
A learning management system (LMS) can generate pages of statistics. That does not mean those statistics will tell you whether your training is working.
A completion rate can tell you who finished a course. It cannot tell you why employees struggled with one module, whether they retained the knowledge, or whether training changed anything on the job.
Good LMS reporting starts with a question. Good LMS analytics takes the answer further and helps you decide what to change.
In this guide, I’ll explain which LMS metrics I would track, which reports are useful for different training tasks, how to read the data, and when learning data needs to be combined with business data.
TL;DR
If you remember one rule from this guide, use this one: do not start with the dashboard. Start with the question.
Decide what you need to know, choose the smallest set of metrics that can answer it, compare those metrics with a meaningful baseline, and decide what you will do with the result.
For most corporate L&D teams, that means tracking a mix of learner progress, course completion, drop-off, assessment results, engagement, compliance status, skills development, and learner feedback.
A manager may need a simple view of overdue training. An instructional designer may need question-level assessment data. An L&D director may need learning data alongside onboarding, quality, sales, or productivity figures.
The same LMS can serve all three people, but they should not receive the same report.
What Is LMS Reporting?
LMS reporting is the process of organizing learning data so that someone can understand what has happened.
A typical LMS records events such as:
- A learner being enrolled in a course
- A course being started or completed
- A deadline being missed
- A quiz being attempted
- A score being achieved
- A certificate being issued
- A training assignment expiring
- A learner joining a session
The LMS then turns those records into reports, tables, exports, or dashboards. For example, a training administrator may run a report showing 312 assigned employees, 287 completions, 18 learners in progress, and seven overdue.
That report answers an operational question: Who has completed the training and who still needs attention? For mandatory training, that may be exactly the answer you need. For other programs, it is only the beginning.
What Is LMS Analytics?
LMS analytics is what happens when you examine learning data to find patterns, explain results, or decide what should happen next. Suppose a sales course has a 62% completion rate. Reporting gives you the 62%.
Analytics asks:
- Is 62% unusually low for this course?
- Where do learners stop?
- Does one department complete it more often than another?
- Are learners failing the same assessment questions?
- Is the course too long?
- Are managers giving employees enough time to take it?
- Did anything change after the course was updated?
You may need several LMS reports to answer those questions.
You may also need data outside the LMS. For example, if the program supports sales training, you might compare learning data with sales performance, conversion, or average deal size.
That requires sales data.
LMS Reporting vs. LMS Analytics
I separate the two because it prevents a common mistake: assuming that having more reports automatically means having better analytics.
| LMS reporting | LMS analytics | |
| Main question | What happened? | What can we learn from what happened? |
| Example | 74% completed onboarding | Completion falls sharply after module four |
| Typical output | Report, export, dashboard | Pattern, comparison, explanation, hypothesis |
| Next action | Contact overdue learners | Review module four and test a revised version |
| Data needed | Often one LMS report | May require several reports or external data |
A dashboard with 20 charts is still reporting if nobody uses those charts to investigate a question.
Likewise, useful analysis does not require an elaborate BI setup. Sometimes comparing two filtered LMS reports is enough.
What LMS Data Can You Track?
The exact fields depend on the LMS, the learning formats you use, and how the system has been configured. I would group the data into six areas.
Learner progress
Progress data answers basic delivery questions.
Common fields include:
- Enrollment
- Course status
- Progress percentage
- Start date
- Completion date
- Due date
- Overdue status
- Certification status
- Training history
This is the foundation for onboarding, mandatory training, certification, and manager follow-up.
Progress data is highly useful when completion itself has operational significance. A completed safety certification matters regardless of whether the course received a five-star rating.
Learner engagement
Engagement is harder to reduce to one number. Depending on the platform, you may see:
- Active learners
- Logins
- Sessions
- Course starts
- Learning activity
- Time spent
- Participation
- Content views
- Drop-off points
I would avoid turning any one of these into an engagement score unless you understand what sits behind it. A learner who spends 45 minutes in a course is not necessarily more engaged than someone who finishes the same material in 20 minutes.
They might be learning carefully. They might also have left the browser tab open.
Assessment and knowledge data
Assessment reports can get much closer to what learners actually understand.
Look for:
- Scores
- Pass rates
- Number of attempts
- Question-level results
- Incorrect answer patterns
- Pre-assessment versus post-assessment results
- Retention checks
Average score alone can hide useful information. An average of 82% sounds healthy. If 70% of employees answered the same safety question incorrectly, I would investigate that question before celebrating the average.
Content performance
Content-level data can help instructional designers decide where to focus their time. Useful signals include:
- Starts
- Completions
- Abandonments
- Repeated failures
- Low-performing modules
- Ratings
- Survey feedback
- Assessment results by course
Compare similar content where possible. A ten-minute optional product update and a two-hour mandatory compliance program have completely different reasons for being opened and completed.
Skills and competencies
Some LMSs now connect courses, assessments, job roles, and skills. When that model is reliable, you may be able to track:
- Required competencies by role
- Current proficiency
- Skills gaps
- Assessment evidence
- Competency progression
- Training assigned to close a gap
I would pay close attention to where the proficiency score comes from. A skill marked as “advanced” carries more weight when it comes from a validated assessment or manager observation than when employees rated themselves.
Compliance and certification
Compliance reporting deserves its own category because incomplete data can create a business risk. Typical fields include:
- Assignment status
- Completion
- Due date
- Overdue status
- Certification date
- Expiration date
- Renewal
- Acknowledgment
- Training history
Here I care less about attractive dashboards and more about whether the record can be trusted. Can you identify who completed the requirement, what they completed, when they completed it, and when they need to repeat it?
That is the useful test.
The Most Important LMS Metrics to Track
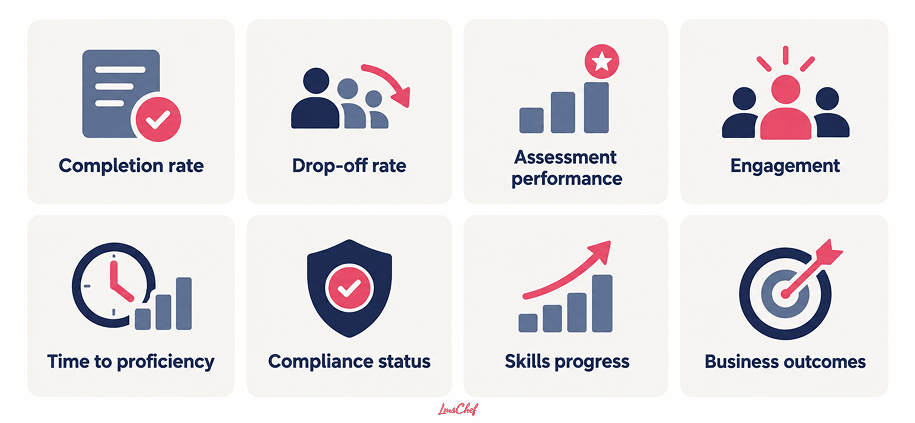
There is no universal set of LMS metrics that every organization should monitor. I would choose them based on the training question. These are the metrics I find most useful.
1. Course completion rate
Course completion rate is simply the percentage of assigned or enrolled learners who completed a course. If 180 employees were assigned training and 153 completed it, the completion rate is 85%.
Completion is valuable for mandatory training, onboarding milestones, certifications, and programs where finishing the learning experience matters. It becomes less meaningful when used as a substitute for learning effectiveness. An employee can complete every slide of a course without learning much.
2. Course drop-off rate
Completion tells you that people disappeared. Drop-off tells you where. That difference matters. If learners abandon a six-module course at roughly the same rate throughout, the issue may be general motivation or workload.
If a large share disappears during module four, I would inspect module four. Look at its length, media, difficulty, assessment, technical behavior, and relevance. Then compare the revised version with your earlier data.
3. Assessment performance
I normally look at several measures together:
- Pass rate
- Average score
- Attempts
- Question-level errors
- Score distribution
Consider a course with a 92% pass rate. That sounds excellent. Now suppose most learners require three attempts because the pass mark is low and the quiz allows unlimited retries. The original 92% tells a much less impressive story.
Always check what created the number.
4. Learner engagement
I would treat engagement as a small collection of behaviors rather than one metric.
For example:
- How many assigned learners start?
- How frequently do they return?
- What percentage finish?
- Where do they leave?
- Do they participate in optional learning?
- Do they use recommended resources?
The right combination changes with the program. For an optional academy, repeat visits may be important. For annual compliance training, repeat visits would tell me very little.
5. Time to completion
Time to completion can expose friction. If new employees usually need nine days to finish a three-hour onboarding path, the issue may have little to do with course duration.
Assignments could be arriving at the wrong time. Managers may not be protecting learning time. Learners may be waiting for instructor sessions or access to other systems. Use the metric to locate the problem, not to diagnose it automatically.
6. Time to proficiency
Time to proficiency is more useful than course completion when the goal is job performance. An employee can finish onboarding on Tuesday and still need another month before working independently.
Define what proficiency means for the role first. It might be a manager observation, a skills assessment, successful completion of a task, or a business performance threshold. You can then compare the learning timeline with that outcome.
7. Compliance completion and overdue rate
For compliance programs, I would watch both completion and overdue training. A 96% completion rate may still mean that dozens of people are working with an expired certification.
Segment the report by department, location, role, manager, or certification type. The segment often tells you who needs action faster than the company-wide percentage.
8. Skills gap and competency progress
A skills metric becomes useful when it answers something specific. For example:
- Which customer support agents need product training?
- Which supervisors have completed the competencies required for promotion?
- Which skills are repeatedly weak across a department?
A company-wide “skills score” can conceal far more than it reveals. I would keep the unit close to the decision you need to make.
9. Learner satisfaction
Course ratings and surveys can tell you whether employees found training clear, relevant, frustrating, or useful. I would never read satisfaction alone. A course can receive excellent ratings because it is entertaining while producing weak assessment results.
Another can receive average ratings while improving job performance. Read sentiment alongside behavior and performance.
10. Knowledge retention
Immediate quiz results tell you what someone could answer immediately after training. A later assessment tells you more about what remained. For programs where retention matters, test again after a useful interval.
The interval depends on the task. A procedure employees perform daily should be evaluated differently from emergency knowledge they may need once a year.
11. Training participation
Participation matters when learning is optional or employee-driven.
You might compare:
- Enrollment
- Course starts
- Self-enrollment
- Repeat participation
- Learning by role or department
Participation is especially useful when you are trying to understand whether people are using a learning catalog.
Again, participation says that learning happened. It does not tell you what changed afterward.
12. Business outcome metrics
This is where LMS analytics can become genuinely interesting, but also where weak conclusions appear quickly.
Possible outcomes include:
- Onboarding speed
- Sales performance
- Error rates
- Quality metrics
- Productivity
- Customer satisfaction
- Employee retention
- Safety incidents
The LMS normally supplies only one side of this comparison.
If sales improve after training, you have evidence that deserves investigation. You do not automatically have proof that the course caused the improvement.
Pricing changes, seasonality, new managers, market conditions, incentives, and product changes may also affect the result.
Types of LMS Reports
The best report is the one that helps someone make a defined decision. Here are the report types I would expect to use most often.
Learner progress reports
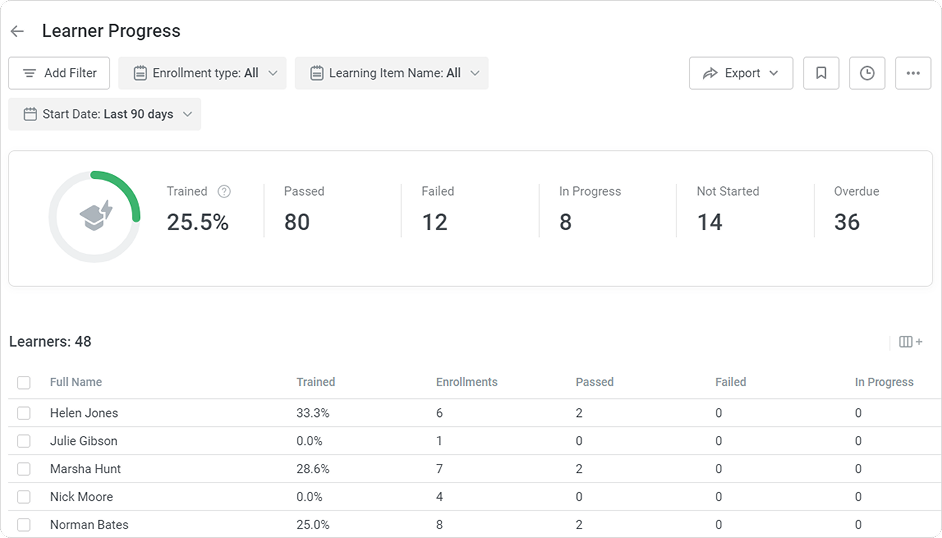
These show where individual learners stand. They are useful for LMS administrators and managers who need to identify:
- Not started training
- In-progress training
- Completed training
- Overdue assignments
- Upcoming deadlines
I would use them for onboarding follow-up, manager conversations, and mandatory programs.
Course completion reports
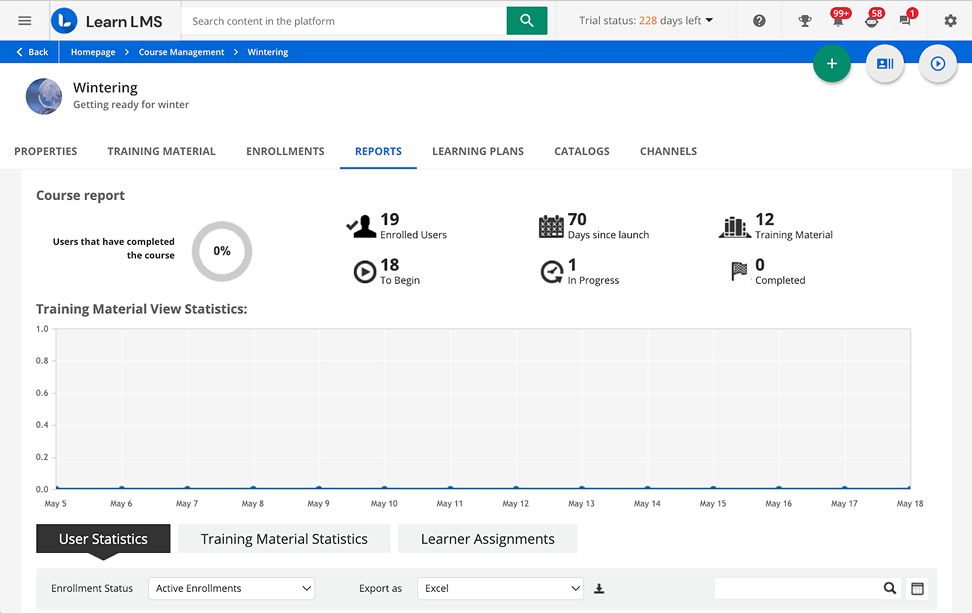
Course completion reports turn the view around. Instead of asking how one learner is progressing, you examine a course or program across many learners.
They can answer:
- How many employees finished?
- Which groups have the lowest completion?
- Is completion improving?
- Are deadlines being met?
Do not stop at the total. Segmenting often exposes the useful part.
Assessment reports
Assessment reports should show more than a final score. For deeper analysis, I want to see attempts and question-level performance where possible. If your LMS records detailed assessment information, use it to find repeated misconceptions rather than simply ranking learners.
Engagement reports
Engagement reports usually combine activity signals such as logins, starts, time, participation, or content interaction. Their usefulness depends heavily on the training model. Before using an engagement metric, ask what behavior you expect from an engaged learner. Otherwise, you risk rewarding activity that has no connection to the learning goal.
Compliance and certification reports
These reports should make risk obvious.
I would want to see:
- Completed
- Outstanding
- Overdue
- Expiring soon
- Expired
For audits, historical records and clear completion evidence matter as much as the current dashboard.
Training history reports
A training history report answers: What has this person completed over time?
It can support employee records, certification checks, internal mobility, manager reviews, and audit requests. When changing LMSs, historical training data is also one of the areas that needs careful attention. I cover that wider process separately in my LMS migration guide.
Skills and competency reports
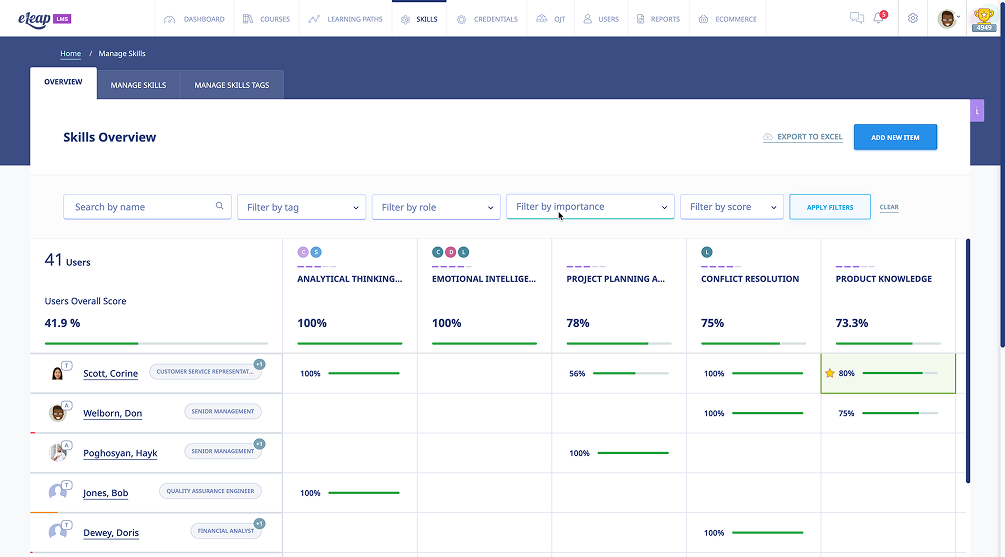
These show development against a defined skills or competency framework. Their usefulness depends on the quality of the framework and evidence. A sophisticated skills dashboard built on weak self-assessment data remains weak data.
Custom reports
Custom reports become important when the standard report almost answers your question, but not quite.
For example, you may need:
- One department
- One location
- One manager
- A specific course group
- A date range
- A custom employee field
- Several conditions together
Different LMSs handle this in different ways.
In iSpring LMS, admins can work with a broad set of ready-made reports and narrow the data using filters for specific learners, groups, courses, and time periods. Reports can also be exported and scheduled, which covers many recurring reporting needs without requiring teams to build every report from scratch.
Docebo gives admins more freedom to build custom reports around users, courses, training materials, and other platform data, then schedule them for regular delivery.
LearnUpon also supports more tailored reporting through its advanced report builder, filters, CSV exports, and scheduled reports. Access can be adjusted for different roles, including administrators, managers, and instructors.
The important question is not whether an LMS has a feature called “custom reports.” It is whether you can narrow, combine, save, and distribute the data in the way your team actually needs.
Four Types of LMS Analytics
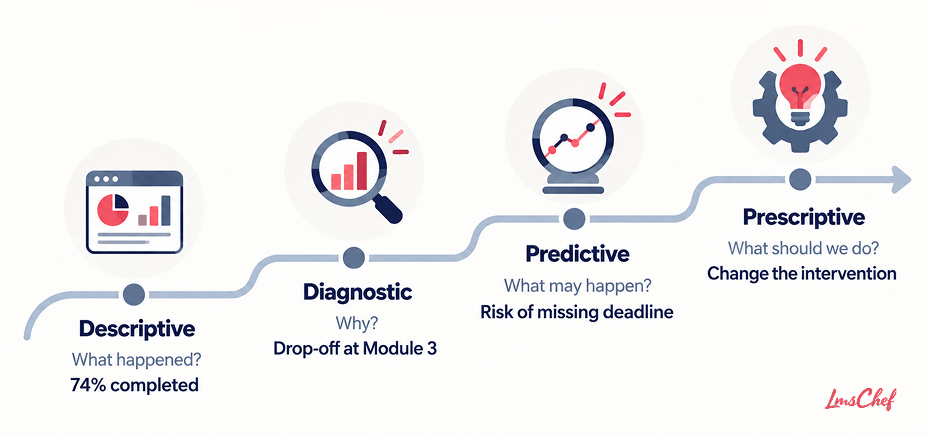
You may see analytics divided into descriptive, diagnostic, predictive, and prescriptive categories. The terminology sounds more complicated than the idea.
Descriptive analytics: What happened?
Example: Course completion fell from 81% to 68%. You are describing a result. Most LMS reporting starts here.
Diagnostic analytics: Why might it have happened?
Now you compare groups, modules, dates, assessments, and learner behavior. You discover that most of the decline occurred among new hires, and many stopped at the same module. You have narrowed the problem. You still need to confirm the explanation.
Predictive analytics: What is likely to happen?
Predictive analytics uses historical patterns to estimate a future outcome. For example, a system might identify learners who appear at risk of not completing a program.
I would check what the vendor means by “predictive” before relying on the label. A dashboard highlighting overdue learners is useful. It is not automatically a predictive model.
Prescriptive analytics: What should we do?
Prescriptive analytics goes one step further and recommends an action. That could mean recommending learning, identifying an intervention, or directing attention toward a high-risk group.
Again, ask what produces the recommendation. A recommendation engine and a business rule can both suggest an action, but they work very differently.
How to Turn LMS Data Into Useful Decisions
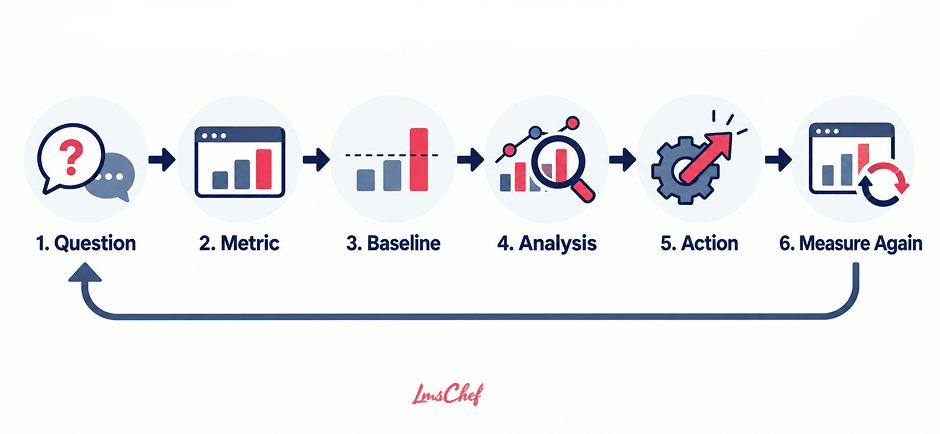
I use a simple sequence:
Question → metric → baseline → analysis → action → measure again
Here is what that looks like.
Example 1: Why are learners abandoning a course?
Question: Why does the cybersecurity course have low completion?
Metrics: Starts, progress, drop-off, assessment results.
Baseline: Compare with earlier versions and similar mandatory courses.
Analysis: Most abandonment occurs before the first assessment.
Action: Review the content immediately before that point. Check length, relevance, technical performance, and difficulty.
Measure again: Compare the revised course with the original cohort.
Notice that “make the course shorter” is not the first conclusion.
The data shows where to investigate. It does not tell you automatically why the problem exists.
Example 2: Who is struggling with a topic?
Question: Why are supervisors repeatedly failing one part of manager training?
Metrics: Question-level results, attempts, department, course version.
You find that one scenario produces errors across almost every department. That points toward the content or assessment rather than one weak learner group. Review the scenario, explanation, scoring, and source policy.
Example 3: Is onboarding becoming faster?
Question: Are new employees becoming productive sooner?
Completion data alone cannot answer it. Combine onboarding progress with a defined business milestone, such as independent task completion, manager sign-off, first successful customer interaction, or target productivity.
Then compare cohorts. If the business milestone improves alongside the training change, you have stronger evidence.
Example 4: Why is compliance training overdue?
Question: Which part of the organization is creating the risk?
Segment overdue training by manager, location, department, role, and due date. You may discover that the company-wide rate is driven almost entirely by one location. That changes the intervention from another company-wide reminder to a conversation with the people responsible for that location.
That is what useful analytics should do. It should narrow the next action.
How to Measure Training ROI With LMS Analytics
LMS data can support an ROI analysis. The LMS rarely supplies the complete answer. I cover the wider calculation process in my guide to calculating LMS ROI. Start with the purpose of the program.
If training was designed to reduce manufacturing errors, I would want:
- Training participation and assessment data
- Error rates before the intervention
- Error rates afterward
- Comparable groups or periods where possible
- The cost of creating and delivering the training
The same logic applies to sales, onboarding, support, safety, and productivity. Suppose salespeople who completed negotiation training increased average deal size by 8%. That is useful evidence.
Before claiming an 8% training impact, check what else changed during the period. Training measurement gets stronger as you remove plausible alternative explanations.
I prefer a cautious conclusion supported by good evidence over an impressive ROI number built on assumptions.
What Should an LMS Reporting Dashboard Include?
The answer depends on who opens it. I would not build one universal dashboard.
An LMS administrator may need:
- Assignments
- Completion
- Overdue learners
- Certifications expiring
- Failed assessments
- Report delivery status
A manager may need:
- Team completion
- Employees requiring follow-up
- Skills gaps
- Required certifications
- Current learning assignments
An instructional designer may need:
- Starts
- Drop-off
- Assessment questions
- Attempts
- Ratings
- Feedback
An L&D leader may need:
- Program reach
- Completion trends
- Skills development
- Compliance risk
- Onboarding progress
- Selected business outcomes
The executive dashboard should normally contain fewer numbers than the administrator dashboard. Senior managers do not need every statistic available in the LMS. They need the numbers connected to decisions they own.
LMS Reporting Features I Would Look For
If reporting matters to your organization, I would test the reporting workflow rather than asking whether the LMS “has analytics.”
Filters and segmentation
Can you filter by department, group, role, manager, location, course, status, and date? Segmentation is often what turns an average into something you can act on.
Saved and custom reports
Can admins save useful report configurations? Can they choose fields and conditions? Custom reports are especially important for organizations with unusual structures or reporting obligations.
Scheduled reporting
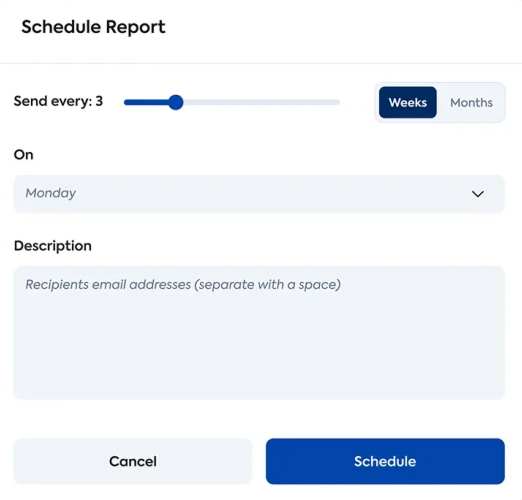
Recurring reports should not require an administrator to download the same spreadsheet every Monday. Look at scheduling frequency, recipients, permissions, filters, and delivery format.
TalentLMS, for example, currently supports scheduled report delivery and custom reports on several paid plans.
LearnUpon also allows advanced reports to run on daily, weekly, or monthly schedules.
Export options
CSV or spreadsheet exports remain useful even when the LMS has good dashboards. You may need to clean data, combine datasets, archive evidence, or perform analysis elsewhere. Test the export with realistic volumes.
Permissions
Managers should not necessarily see the same data as LMS administrators. Check whether access can follow teams, groups, roles, portals, or other organizational structures. Reporting permissions are part of reporting design, especially when employee and performance data are involved.
Dashboards and visualization
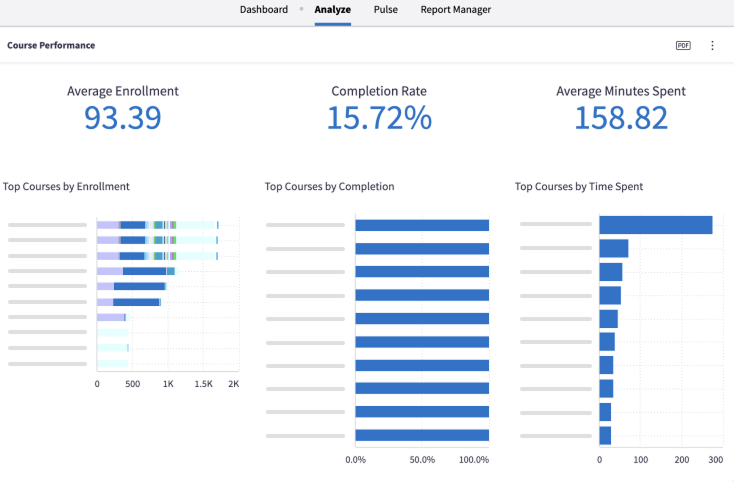
Charts are useful when they make a pattern easier to see.
I would ask:
- Can the dashboard be filtered?
- Can different roles receive different views?
- How frequently does the data refresh?
- Can I reach the underlying records?
- What happens when I need something outside the dashboard?
Absorb illustrates why those questions matter. Its Analyze product supports configurable dashboard reporting, but the vendor also documents separate Analyze roles and data refresh intervals that can vary by setup.
A dashboard’s refresh schedule can matter when someone assumes they are looking at live compliance data.
Historical data
Ask how far back the reports go and what happens when users, courses, groups, or certifications change. Current status is only part of reporting. Audits and trend analysis depend on history.
APIs and BI access
Some organizations eventually need LMS data beside HR, CRM, operational, or financial data. That may involve exports, an API, Power BI, another BI platform, or a data warehouse. I would keep that question separate from basic LMS reporting.
If you are planning the actual system connections and data flows, see my guide to LMS integrations rather than treating a BI logo on a vendor page as proof that your use case will work.
Common LMS Reporting Mistakes
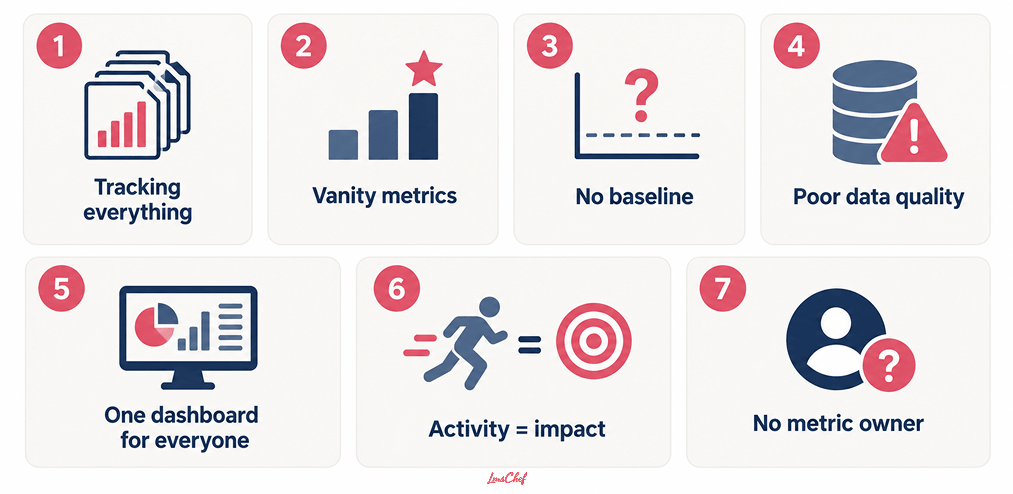
Most reporting problems I see are not caused by a lack of data. They come from how the data is used.
Tracking everything
More metrics create more work. If nobody knows what decision a metric supports, I would question why it is on the dashboard.
Using vanity metrics
“12,000 course views” sounds impressive.
Was 12,000 good?
Did the right employees view the content?
Did they learn anything?
Did anything change?
A large number is not automatically a useful number.
Having no baseline
A completion rate of 72% can be excellent or terrible depending on the program. Compare it with something meaningful: an earlier cohort, another version, a similar course, a target, or a comparable learner group.
Ignoring data quality
Bad enrollment rules, duplicate accounts, inconsistent departments, outdated manager assignments, and poorly configured completions can all corrupt reports. Do not analyze a number until you understand how it was created.
Giving everyone the same dashboard
Managers, administrators, executives, and instructional designers make different decisions. Their reporting should reflect that.
Confusing activity with impact
Logins, views, time spent, and completions show activity. They do not automatically show learning or job performance. Use assessments, behavior, skills, and relevant business outcomes when the question requires them.
Collecting data with no owner
Every important metric should have someone responsible for reviewing it. It should also have an action attached to a meaningful threshold. If compliance completion falls below the target, who responds? If one assessment question fails repeatedly, who reviews it? Without an owner, the dashboard becomes decoration.
LMS Reporting and Analytics Checklist
Before creating another report, I would answer these questions:
- What question are we trying to answer?
- Who will use the result?
- Which metric can answer the question?
- Where does the data come from?
- How is each field or metric defined?
- What baseline will we use?
- Do we need to segment the result?
- Can we trust the underlying data?
- How often does the report need to run?
- Who owns the result?
- What result would trigger action?
- Do we need data outside the LMS?
- Does the report contain sensitive employee data?
- Who should have permission to see it?
- When will we review the metric again?
Use the same questions during an LMS demo. Reporting is only one part of the evaluation, so use these questions alongside the broader process in my guide on how to choose an LMS
Instead of asking the vendor to “show me the analytics,” give them a reporting problem. Ask them to show how you would identify employees with overdue certification in one department.
Then ask how you would schedule that report for the department manager. Then ask how you would export the underlying data. That tells you much more than a tour of polished dashboards.
Final Thoughts
Better LMS reporting does not begin with more charts. It begins with a better question. Completion, assessment scores, engagement, skills data, and business outcomes all have their place. Their value depends on the decision you are trying to make.
I would rather have five LMS metrics that people review and act on than 50 metrics filling a dashboard nobody uses. Start with the question. Check how the LMS records the data. Establish a baseline. Analyze the result. Take an action. Then measure again.
That is where LMS reporting becomes useful.
FAQs
What is the difference between LMS reporting and LMS analytics?
Reporting primarily tells you what happened. Analytics examines the data to understand patterns, possible causes, risks, and next actions. For example, a report may show a 60% completion rate. Analytics could reveal that most learners abandon the course during the same module.
What metrics should an LMS track?
For corporate learning, I would look first at completion, drop-off, assessment performance, learner engagement, time to completion, compliance status, skills progression, feedback, and relevant business outcomes. The exact list should follow your training goals.
What reports should an LMS provide?
Common LMS reports include learner progress, course completion, assessments, compliance, certifications, training history, engagement, and skills reports.
Organizations with more complex needs may also require custom reporting, scheduled delivery, exports, and role-based reporting permissions.
How do you measure LMS effectiveness?
Do not use one LMS statistic as a universal effectiveness score. Measure whether the platform gives you the information needed to run learning programs and whether those programs achieve their defined outcomes. For one program that might mean certification completion. For another, it might mean improved assessment performance or faster onboarding.
Can LMS data be exported to Power BI or another BI tool?
Many LMSs allow data to leave the platform through exports, APIs, or dedicated integrations. The exact method and available fields vary by product and plan. If BI reporting is important, test the exact dataset you need instead of checking only whether the vendor lists Power BI or API access among its features.